Iowa's Annual Wind Generation
This information relates to electricity generated from wind resources. See Iowa's Electric Profile for more information on electric generation from all sources.
| Year | Wind Nameplate Capacity MW(1) | Wind Electric Generation MWh(2) | Percent of Iowa's Total Electric Energy Generation from Wind(3) |
|---|---|---|---|
| 2021 | 11,804.1 | 37,098,274 | 55.20% |
| 2020 | 11,406.9 | 34,182,302 | 57.32% |
| 2019 | 9,906.3 | 25,328,971 | 41.07% |
| 2018 | 8,386.7 | 21,334,053 | 33.66% |
| 2017 | 7.098.7 | 21,372,752 | 36.91% |
Note: (1) IUB updates the values for past years based on the U.S. Energy Information Administration (EIA) data.
Source Notes: (1) Wind Nameplate Capacity by megawatts (MW) for 2006-2021 based on generator information in Form EIA-860 based on generating units greater than 1 MW, physically located in Iowa, where wind is identified as the prime mover for the applicable year.
(2) Wind Energy Generated by megawatt hours (MWh) for 2006-2021 was taken from Form EIA-923. This energy was generated from units greater than 1 MW within the state of Iowa, but some portion of the energy may have been consumed out of state. The data applicable to the years 2006-2021 comes from the final EIA-923 data for each applicable year.
(3) This column is calculated by comparing wind-based generation to generation from all fuel sources based on EIA-923.
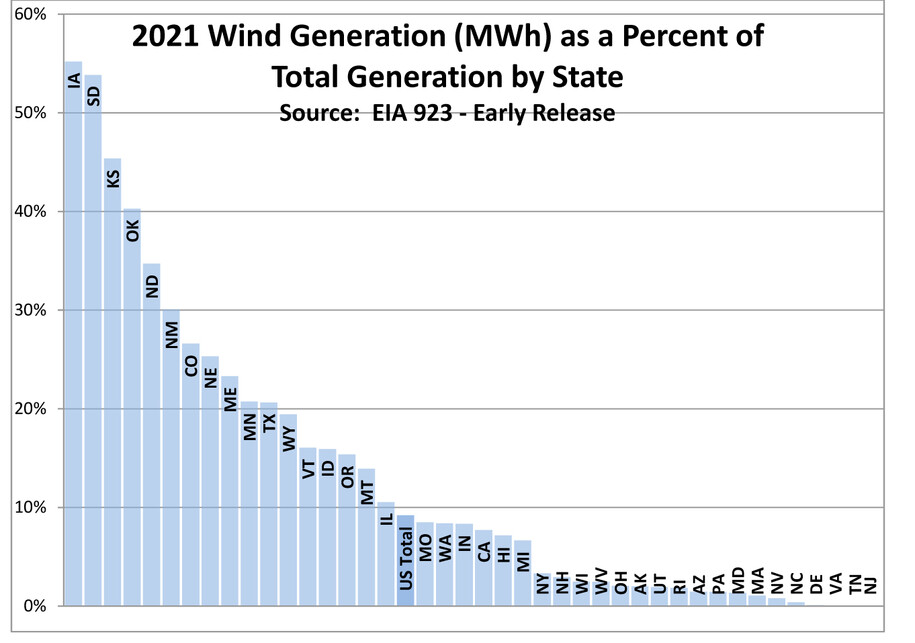
Source: 2021 generation by fuel source per EIA 923. Some portion of both the wind and non-wind energy generated within a state may have been consumed out of state. Download combined data table.
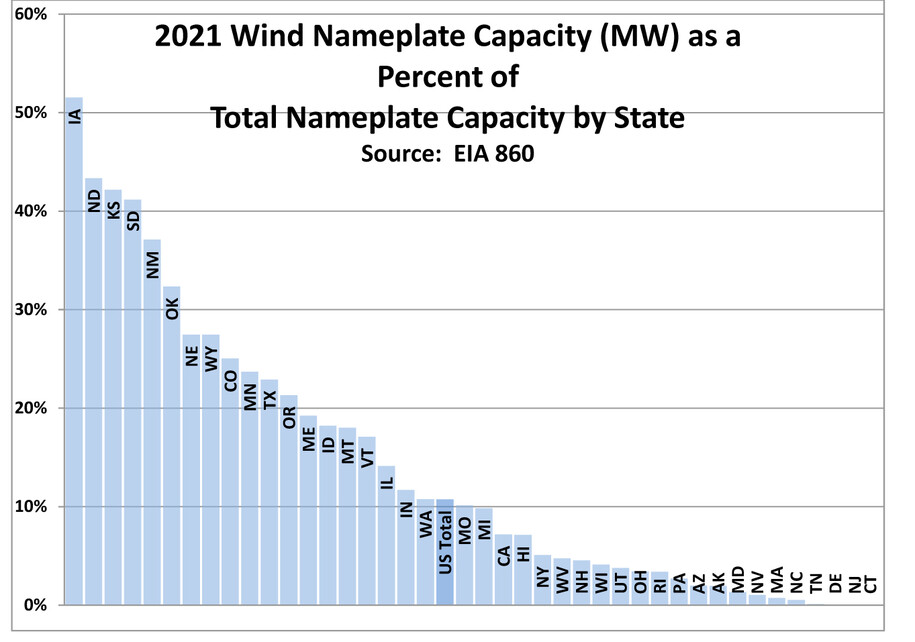
Source: Wind Nameplate Capacity for 2021 based on generator information in Form EIA 860 Annual Electric Report. Download combined data table.
Questions? Please refer to IUB's Common Questions about Wind Energy document.